Introduction
The alert definition feature allows you to set alerts on a metric using a PromQL query. It is currently defined in the K8s ConfigMap named opsramp-alert-user-config, which you can find in the OpsRamp agent installed namespace.
The Kubernetes 2.0 agent computes the alert metric value based on the PromQL expression and computes the alert state by comparing the thresholds in the alert definition.
The OpsRamp Agent sends the alert on the K8s resource based on labels generated in resultant metric streams after running promQL query. If no resource matches with labels then alert will be sent on the cluster.
Alert Definition Template
Sample template to define a single alert:
  - resourceType: k8s_resource_type
    rules:
      - name: alert_definition_name
        component: component_labels
        interval: alert_polling_time
        expr: promql_expression
        isAvailability: true
        warnOperator: operator_macro
        warnThreshold: str_threshold_value
        criticalOperator: operator_macro
        criticalThreshold: str_threshold_value
        alertSub: alert_subject
        alertBody: alert_description
Explanation of template fields:
resourceType: Specify the type of K8s resource (e.g., k8s_pod). Following are the possible values for resourceType:- k8s_pod
- k8s_node
- k8s_namespace
- k8s_deployment
- k8s_replicaset
- k8s_daemonset
- k8s_statefulset
rules: A set of rules for the alert definition.name: A unique name for the alert.component: Component or instance name for the alert.
You can specify this using any label key in either of the following formats:component: "{{ $labels.display_name }}"
(OR)component: "${labels.display_name}"interval: Polling interval at which alert definition should run. The interval should given in time duration format (e.g., 1m, 5m, 1h).expr: A valid PromQL query expression for calculating the metric.isAvailability: Boolean indicating if the alert should consider resource availability.warnOperator&criticalOperator: Operators to compare and compute alert states. OpsRamp supports below operators for comparison:GREATER_THAN_EQUALGREATER_THANEQUALNOT_EQUALLESS_THAN_EQUALLESS_THAN
warnThreshold&criticalThreshold: Values for warning and critical thresholds.alertSub&alertBody: Content displayed for alerts, which can use macros for dynamic values. Below are macros that can be used while defining alert subject/body:- ${
severity} - ${
metric.name} - ${
component.name} - ${
metric.value} - ${
threshold} - ${
resource.name} - ${
resource.uniqueid} {{ $labels.anyLabelKey }}
- ${
Configure Alert
OpsRamp provides basic alert definitions for resources like pods and nodes by default. Users can configure the alert definitions by using the K8s ConfigMap below in the namespace where the agent is installed.
K8s ConfigMap Name: opsramp-alert-user-config
Step 1: Get the Existing ConfigMap
Check the existing configuration by running:
kubectl get configmap opsramp-alert-user-config -n <agent-installed-namespace> -oyamlSample ConfigMap:
apiVersion: v1
kind: ConfigMap
metadata:
  name: "opsramp-alert-user-config"
  namespace: opsramp-agent
data:
  alert-definitions.yaml: |
    alertDefinitions:
      - resourceType: k8s_cluster
        rules:
          - name: k8s_apiserver_requests_error_rate
            interval: 5m
            expr: (sum(increase(apiserver_request_total{verb!="WATCH",code=~"2.."}[5m]))/ sum(increase(apiserver_request_total{verb!="WATCH"}[5m])))*100
            isAvailability: true
            warnOperator: LESS_THAN
            warnThreshold: '85'
            alertSub: '${severity} - Cluster ${resource.name} API Server availability dropped below ${threshold}%'
            alertBody: 'The API server on cluster ${resource.name} is returning errors on the metric ${metric.name}. Only ${metric.value}% of non-WATCH requests succeeded in the last 5 minutes than the defined threshold of ${threshold}%. Investigate API server logs and cluster health.'
          - name: k8s_cluster_nodes_health
            interval: 5m
            expr: (sum(((k8s_node_condition_ready == bool 1) * (k8s_node_condition_disk_pressure == bool 0) * (k8s_node_condition_memory_pressure == bool 0) * ((k8s_node_condition_network_unavailable != bool 1) OR on(k8s_node_name) (k8s_node_condition_ready == bool 1)) * ((k8s_node_condition_pid_pressure != bool 1) OR on(k8s_node_name) (k8s_node_condition_ready == bool 1))))/sum(k8s_node_condition_ready))*100
            isAvailability: true
            warnOperator: LESS_THAN
            warnThreshold: '80'
            criticalOperator: LESS_THAN
            criticalThreshold: '60'
            alertSub: '${severity} - Cluster ${resource.name} Healthy nodes percentage below ${threshold}%'
            alertBody: 'Cluster ${resource.name} has only ${metric.value}% healthy nodes than the threshold of ${threshold}%. Verify node conditions (Ready, DiskPressure, MemoryPressure, Network).'

      - resourceType: k8s_pod
        rules:
          - name: k8s_pod_phase
            interval: 5m
            expr: (k8s_pod_phase == bool 2) OR (k8s_pod_phase == bool 3)
            isAvailability: true
            criticalOperator: EQUAL
            criticalThreshold: '0'
            alertSub: '${severity} - Pod ${resource.name} is in Failed or Unknown state.'
            alertBody: 'Pod ${resource.name} has entered phase ${metric.value} (Failed/Unknown). Immediate attention required to restore workload.'
          - name: k8s_pod_cpu_usage_percent
            interval: 5m
            expr: (sum by (k8s_pod_name, k8s_namespace_name) (k8s_pod_cpu_usage) / sum by (k8s_pod_name, k8s_namespace_name) (k8s_container_cpu_limit)) * 100
            isAvailability: false
            warnOperator: GREATER_THAN_EQUAL
            warnThreshold: '90'
            criticalOperator: GREATER_THAN_EQUAL
            criticalThreshold: '95'
            alertSub: '${severity} - Pod ${resource.name} CPU Usage is above ${threshold}%'
            alertBody: 'Pod ${resource.name} CPU usage is ${metric.value}%  than the defined threshold of ${threshold}%. Check workload resource requests/limits or scaling.'
          - name: k8s_pod_memory_usage_percent
            interval: 5m
            expr: (sum by (k8s_pod_name, k8s_namespace_name) (k8s_pod_memory_working_set) / sum by (k8s_pod_name, k8s_namespace_name) (k8s_container_memory_limit)) * 100
            isAvailability: true
            warnOperator: GREATER_THAN_EQUAL
            warnThreshold: '90'
            criticalOperator: GREATER_THAN_EQUAL
            criticalThreshold: '95'
            alertSub: '${severity} - Pod ${resource.name} Memory Usage is above ${threshold}%'
            alertBody: 'Pod ${resource.name} memory usage is ${metric.value}%  than the defined threshold of ${threshold}%. Investigate memory leaks or adjust memory requests/limits.'

      - resourceType: k8s_node
        rules:
          - name: k8s_node_condition
            interval: 5m
            expr: ((k8s_node_condition_ready == bool 1) * (k8s_node_condition_disk_pressure == bool 0) * (k8s_node_condition_memory_pressure == bool 0) * ((k8s_node_condition_network_unavailable != bool 1) OR on(k8s_node_name) (k8s_node_condition_ready == bool 1)) * ((k8s_node_condition_pid_pressure != bool 1) OR on(k8s_node_name) (k8s_node_condition_ready == bool 1)))
            isAvailability: true
            criticalOperator: EQUAL
            criticalThreshold: '0'
            alertSub: '${severity} - Node ${resource.name} is unhealthy.'
            alertBody: 'Node ${resource.name} failed one or more health conditions (Ready, DiskPressure, MemoryPressure, Network, PIDPressure). Metric: ${metric.value}. Immediate remediation needed.'
          - name: k8s_node_cpu_usage_percent
            interval: 5m
            expr: ((sum by (k8s_node_name) (k8s_node_cpu_usage) / sum by (k8s_node_name) (k8s_node_allocatable_cpu)) * 100)
            isAvailability: false
            warnOperator: GREATER_THAN_EQUAL
            warnThreshold: '90'
            criticalOperator: GREATER_THAN_EQUAL
            criticalThreshold: '95'
            alertSub: '${severity} - Node ${resource.name} CPU Usage is above ${threshold}%'
            alertBody: 'Node ${resource.name} CPU usage is ${metric.value}% than the defined threshold of ${threshold}%. Consider scaling nodes or workloads.'
          - name: k8s_node_memory_usage_percent
            interval: 5m
            expr: (sum by (k8s_node_name) (k8s_node_memory_working_set) / (sum by (k8s_node_name) (k8s_node_memory_working_set + k8s_node_memory_available))) * 100
            isAvailability: true
            warnOperator: GREATER_THAN_EQUAL
            warnThreshold: '90'
            criticalOperator: GREATER_THAN_EQUAL
            criticalThreshold: '95'
            alertSub: '${severity} - Node ${resource.name} Memory Usage is above ${threshold}%'
            alertBody: 'Node ${resource.name} memory usage is ${metric.value}% than the defined threshold of ${threshold}%. Investigate workload memory usage or scale resources.'
          - name: k8s_node_disk_usage_percent
            interval: 5m
            expr: (sum by (k8s_node_name) (k8s_node_filesystem_usage) / sum by (k8s_node_name) (k8s_node_filesystem_capacity)) * 100
            isAvailability: false
            warnOperator: GREATER_THAN_EQUAL
            warnThreshold: '90'
            criticalOperator: GREATER_THAN_EQUAL
            criticalThreshold: '95'
            alertSub: '${severity} - Node ${resource.name} Disk Usage on  ${component.name}  is above ${threshold}%'
            alertBody: 'Node ${resource.name} Disk usage on ${component.name} is ${metric.value}% than the defined threshold of ${threshold}%. Validate the possibilities to cleanup or scale resources.'

      - resourceType: k8s_namespace
        rules:
          - name: k8s_namespace_memory_mb
            interval: 5m
            expr: (sum by (k8s_cluster_name, k8s_namespace_name) (k8s_pod_memory_usage/1000000))
            isAvailability: true
            warnOperator: GREATER_THAN_EQUAL
            warnThreshold: '50000'
            alertSub: '${severity} - Namespace ${resource.name} Memory Usage is above ${threshold} MB.'
            alertBody: 'Namespace ${resource.name} memory usage is ${metric.value} MB than the defined threshold of ${threshold} MB. Investigate workload memory usage or scale resources.'

      - resourceType: k8s_deployment
        rules:
          - name: k8s_deployment_status
            interval: 5m
            expr: (k8s_deployment_available/k8s_deployment_desired)
            isAvailability: true
            warnOperator: LESS_THAN_EQUAL
            warnThreshold: '0.9'
            criticalOperator: LESS_THAN_EQUAL
            criticalThreshold: '0.8'
            alertSub: '${severity} - Deployment ${resource.name} availability below threshold of ${threshold} of the Cluster ${resource.name}.'
            alertBody: 'Deployment ${resource.name} has only ${metric.value} available replicas than the defined threshold of ${threshold} of the Cluster ${resource.name}. Some Pods may not be running as expected.'

      - resourceType: k8s_replicaset
        rules:
          - name: k8s_replicaset_status
            interval: 5m
            expr: (k8s_replicaset_available/k8s_replicaset_desired)
            isAvailability: true
            warnOperator: LESS_THAN_EQUAL
            warnThreshold: '0.9'
            criticalOperator: LESS_THAN_EQUAL
            criticalThreshold: '0.8'
            alertSub: '${severity} - ReplicaSet ${resource.name} availability below threshold of ${threshold} of the Cluster ${resource.name}.'
            alertBody: 'ReplicaSet ${resource.name} has only ${metric.value} available replicas  than the defined threshold of ${threshold} of the Cluster ${resource.name}. Validate Pod scheduling and resource capacity.'

      - resourceType: k8s_daemonset
        rules:
          - name: k8s_daemonset_status
            interval: 5m
            expr: >-
              (k8s_daemonset_current_scheduled_nodes/k8s_daemonset_desired_scheduled_nodes)
            isAvailability: true
            warnOperator: LESS_THAN_EQUAL
            warnThreshold: '0.9'
            criticalOperator: LESS_THAN_EQUAL
            criticalThreshold: '0.8'
            alertSub: '${severity} - DaemonSet ${resource.name} scheduled limit is below the threshold of ${threshold} of the Cluster ${resource.name}.'
            alertBody: 'DaemonSet ${resource.name} has only ${metric.value} nodes scheduled  than the defined threshold of ${threshold} of the Cluster ${resource.name}. Some nodes are missing DaemonSet Pods.'

      - resourceType: k8s_statefulset
        rules:
          - name: k8s_statefulset_status
            interval: 5m
            expr: (k8s_statefulset_current_pods/k8s_statefulset_desired_pods)
            isAvailability: true
            warnOperator: LESS_THAN_EQUAL
            warnThreshold: '0.9'
            criticalOperator: LESS_THAN_EQUAL
            criticalThreshold: '0.8'
            alertSub: '${severity} - StatefulSet ${resource.name} availability below threshold of ${threshold} of the Cluster ${resource.name}.'
            alertBody: 'StatefulSet ${resource.name} has only ${metric.value} running Pods  than the defined threshold of ${threshold} of the Cluster ${resource.name}. Check persistent volumes and StatefulSet events.'
You can remove and add new alerts using the standard PromQL expression.
Step 2: Edit an Existing ConfigMap
To modify an existing configuration, use:
kubectl edit configmap opsramp-alert-user-config -n <agent-installed-namespace>You can Add or Remove new alerts using standard PromQL expressions.
Step 3: Save and Apply the Changes
After editing, save your changes. The updated configuration will be applied automatically to your agent.
Configure Availability
To configure availability of a resource, define alert definition and make the key isAvailability as true.
Same alert definition rule will be used to compute the availability of a resource. For example, if we want to define Pod availability based on pod memory usage, we can give alert definition as below with isAvailability as true.
- resourceType: k8s_resource_type
    rules:
      - name: k8s_pod_memory_usage_percent
        interval: 5m
        expr: (sum by (k8s_pod_name, k8s_namespace_name) (k8s_pod_memory_working_set) / sum by (k8s_pod_name, k8s_namespace_name) (k8s_container_memory_limit)) * 100
        isAvailability: true
        warnOperator: GREATER_THAN_EQUAL
        warnThreshold: '90'
        criticalOperator: GREATER_THAN_EQUAL
        criticalThreshold: '95'
        alertSub: '${severity} - Pod ${resource.name} Memory Usage is above ${threshold}%'
        alertBody: 'Pod ${resource.name} memory usage is ${metric.value}%  than the defined threshold of ${threshold}%. Investigate memory leaks or adjust memory requests/limits.
Here if k8s_pod_memory_usage_percent is either warning or critical, availability will be considered as down otherwise up.
Refer to the Alert Definition Repository document for detailed information on each alert rule and its related alert definition expression.
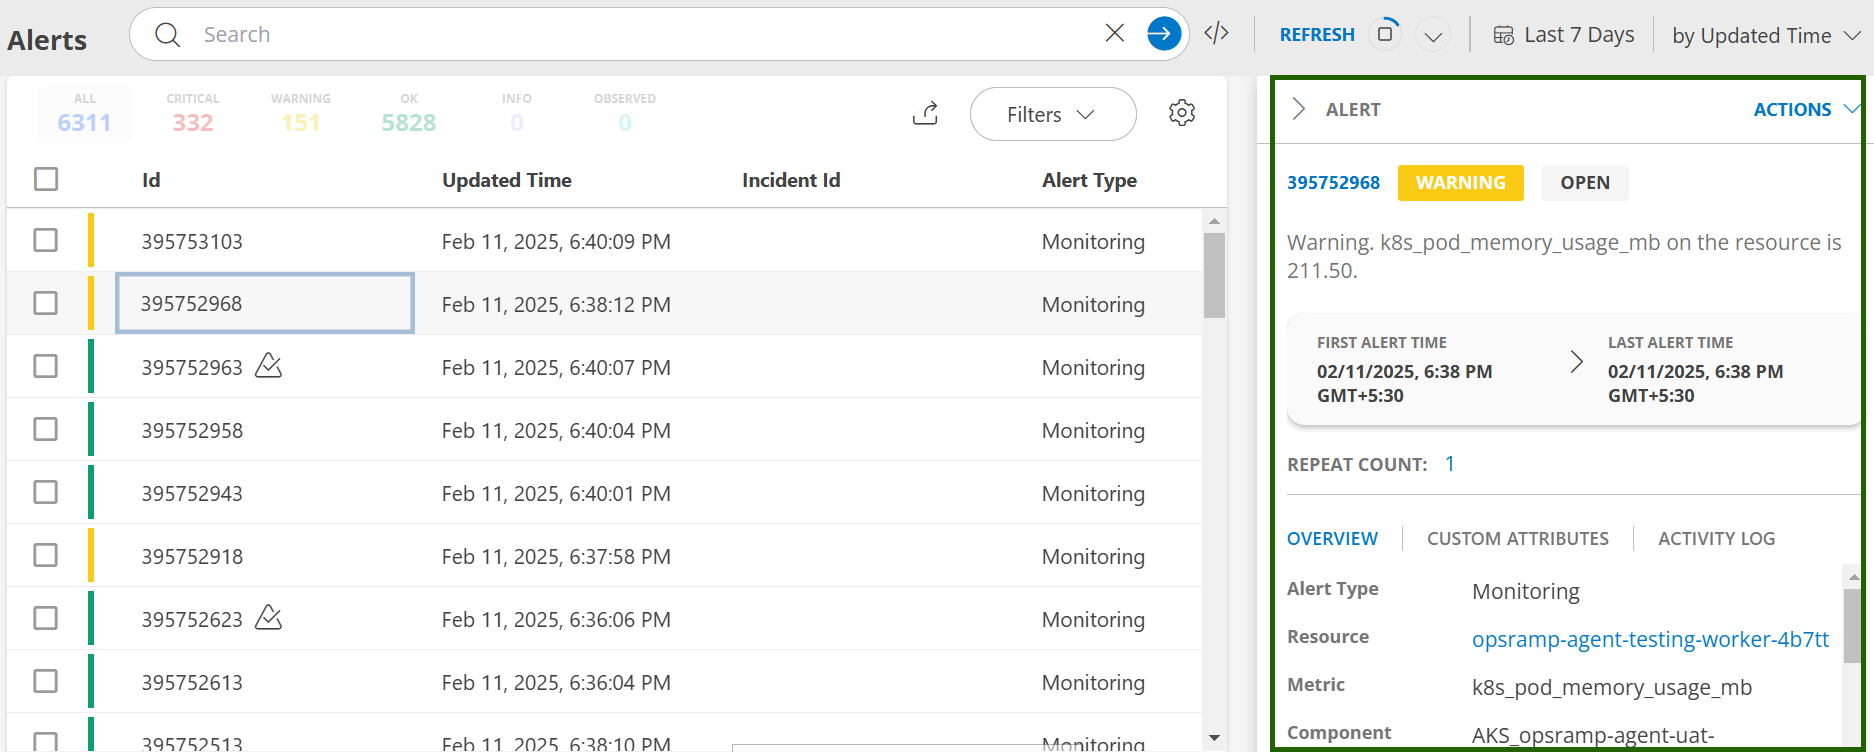
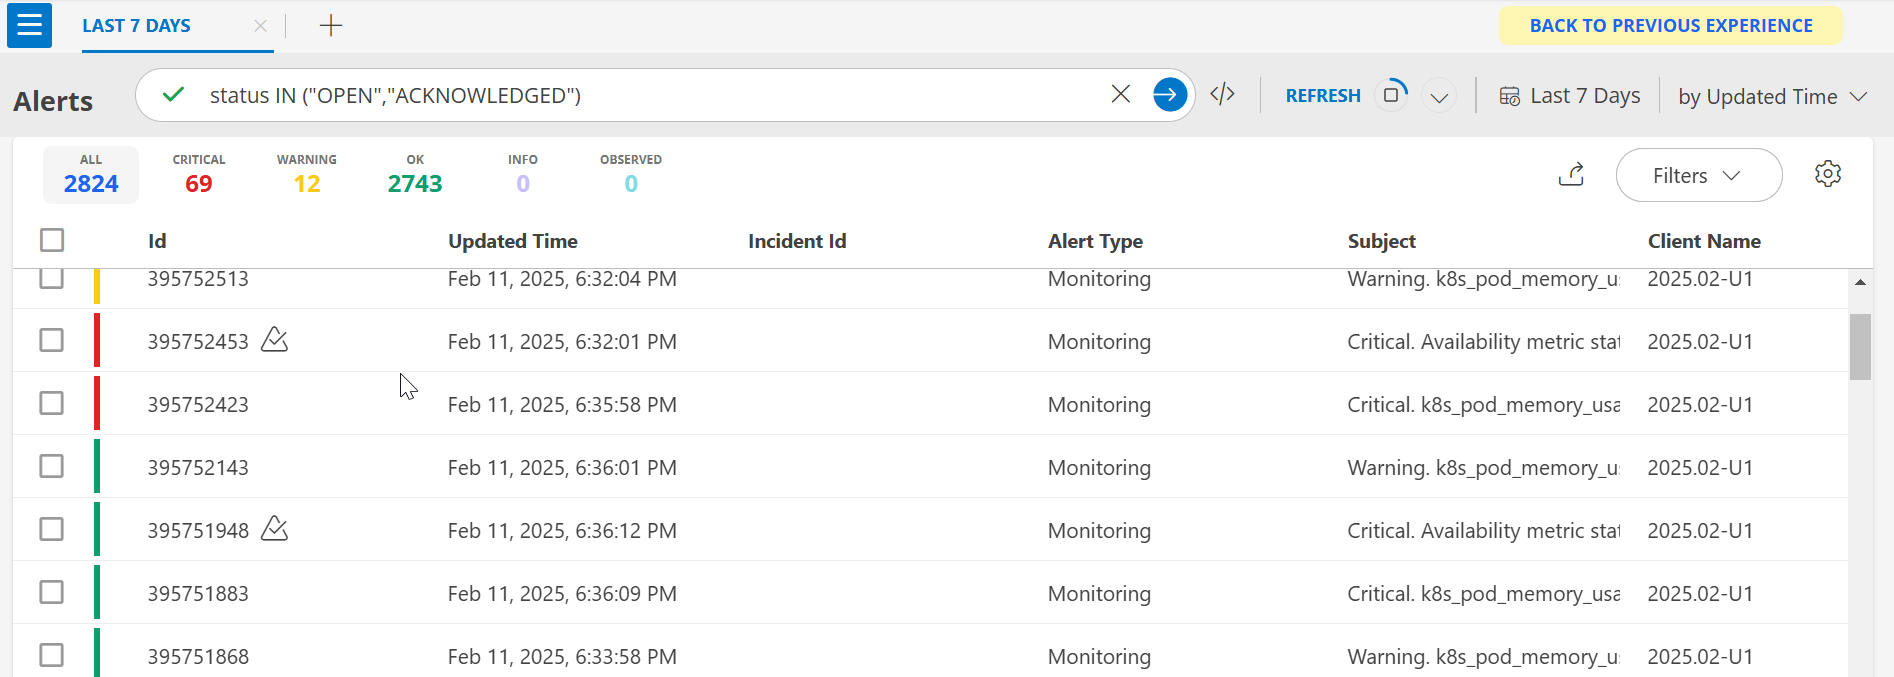
View Alerts in OpsRamp Portal
Users can view logs in the OpsRamp portal from Command Center > Alerts.
- Default Alerts Screen: View your alerts through the Alerts UI.
- Alerts Details: Click on any alert entry for detailed information.