Once eBPF is configured, you can explore the eBPF analytics through the OpsRamp UI.
From Infrastructure Section
- Navigate to Infrastructure > eBPF Analytics in the OpsRamp portal.
- The eBPF Configuration Analytics page will be displayed.

- Select the Cluster, Namespace, and Pod to view network visibility insights.

From Search Section
- Navigate to Infrastructure > Search in the portal.
- Click on a Kubernetes 2.0 Cluster.
- Select Pods to view the pod list.

- On the resource page, click the arrow symbol next to a pod.

- In the resource details screen, click the three-dot icon to access the menu.

- Select eBPF Analytics from the menu to open the eBPF Dashboard.
Using Search Option
- Navigate to Infrastructure > Search.
- Click on the Search icon.

- Search resources with filter: NativeType = “k8s pod”.

- Click a pod, then use the three-dot menu to open eBPF Analytics.

Important Note for Trace Services
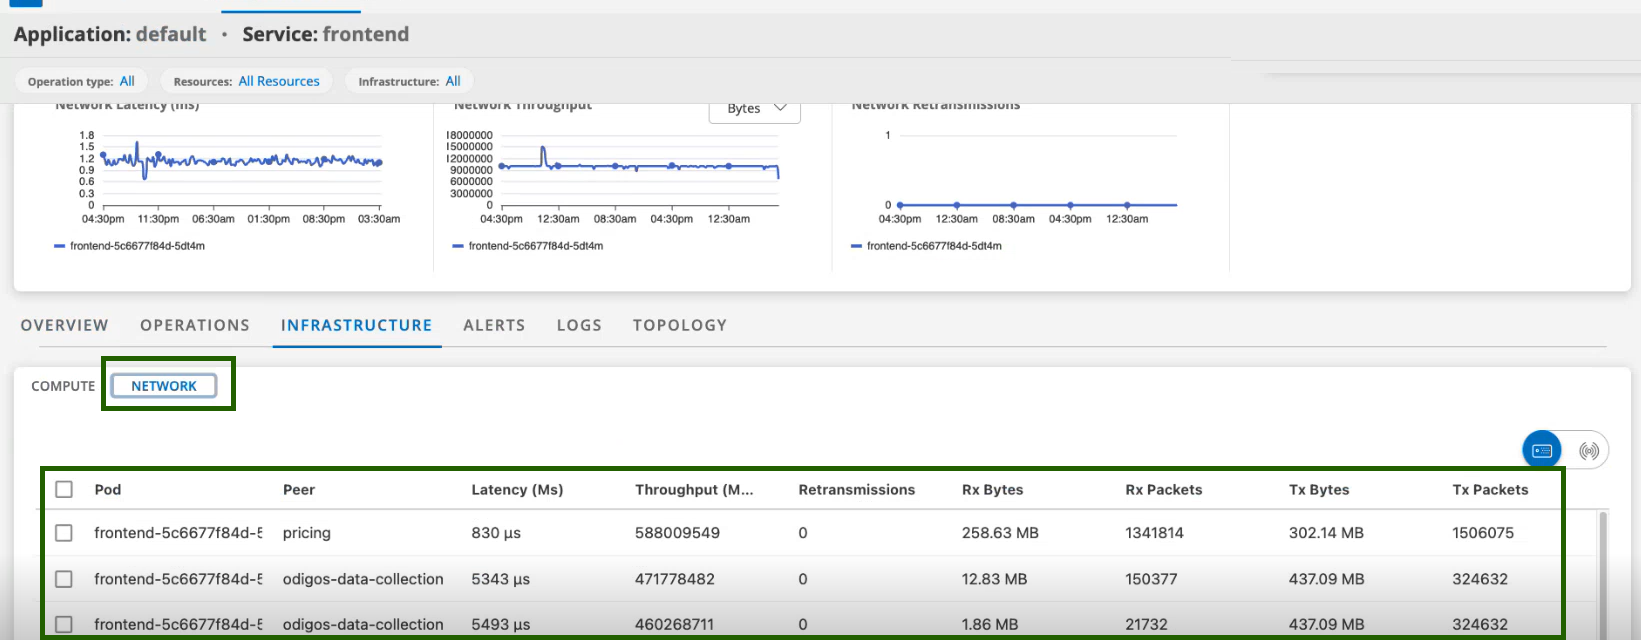
Once the eBPF feature is enabled, you will notice the following new changes in Trace Services under Infrastructure > Traces:
- Three additional graphs: Network Latency, Network Throughput, and Network Retransmission will appear alongside the existing graphs.


- A new Network option will be available under the Infrastructure section for a particular service. Click on it to view the detailed network information.